Rebol3 Code Examplex
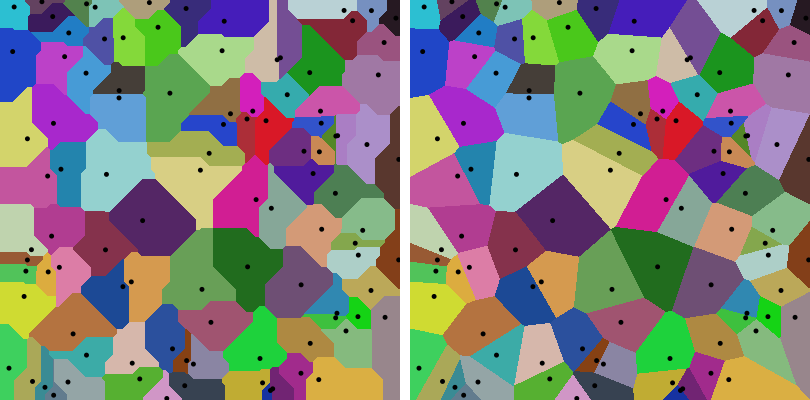
Voronoi diagram
Divide a plane into regions around a set of points so each region contains the locations closest to one point.
Rebol [
    title: "Rosetta code: Voronoi diagram"
    file:  %Voronoi_diagram.r3
    url:   https://rosettacode.org/wiki/Voronoi_diagram
    needs: blend2d
]

voronoi-diagram: function [
    canvas [pair!]
    points [integer!]
][
    diagram-1: make image! canvas
    diagram-2: make image! canvas
    cx: canvas/x
    cy: canvas/y

    ;-- Generate random origin points with respective region colors
    random/seed 1 ;now/time/precise
    spec: make block! 2 * points
    loop points [
        repend spec [
            random cx random cy
            20.20.20 + random 200.200.200
        ]
    ]

    ;-- Color each pixel, based on region it belongs to
    repeat y cy [
        repeat x cx [
            min-dist1: min-dist2: 1.#Inf
            foreach [px py color] spec [
                ;; Taxicab distance
                d1: (absolute (px - x)) + absolute (py - y)
                ;; Euclidean distance
                d2: square-root ((px - x) ** 2 + ((py - y) ** 2))
                if d1 < min-dist1 [min-dist1: d1 color-1: color]
                if d2 < min-dist2 [min-dist2: d2 color-2: color]
            ]
            coord: as-pair x y
            diagram-1/:coord: color-1
            diagram-2/:coord: color-2
        ]
    ]

    ;-- Draw origin points for regions
    points: #(f64! [])
    foreach [x y c] spec [repend points [x y]]
    cmds: copy [point-size 5 fill black point :points]
    draw diagram-1 cmds
    draw diagram-2 cmds

    ;-- Merge both diagrams into one image
    draw canvas * 2x1 + 10x0 compose [
        clear-all ;; transparent background
        image :diagram-1 0x0
        image :diagram-2 (canvas * 1x0 + 10x0)
    ]
]

img: voronoi-diagram 400x400 100
browse save %Voronoi_diagram.png img